Code
import pandas as pd
import plotly.express as px
from helper import process_baseball_data
import plotly.graph_objects as go

REFERENCE_YEAR = 2025import pandas as pd
import plotly.express as px
from helper import process_baseball_data
import plotly.graph_objects as go
REFERENCE_YEAR = 2025The Dodgers, defending World Series champs, entered 2025 with sky-high expectations. How are they measuring up about 33 games in?
As of early May, they boast a stellar 27-14 (.659) record, sitting atop the NL West with a 1-game lead over the Padres. They’re recently split a 4-game series against the Arizona Diamondbacks. The Dbacks could very well be a play-off opponent. A series split, coupled with a sub-0.500 record against winning teams, could orchestrate a rivertting play-off scene.
| Team | W | L | PCT | L10 |
|---|---|---|---|---|
| Dodgers | 27 | 14 | 0.659 | 6-4 |
| Padres | 25 | 14 | 0.641 | 7-3 |
| Giants | 24 | 18 | 0.571 | 5-5 |
| Diamondbacks | 22 | 20 | 0.524 | 5-5 |
| Rockies | 7 | 34 | 0.171 | 1-9 |
They surpass their record from one year ago today, where they were 27-14 and 41 games into the season. Let’s see how their expected wOBA fares from last year.
# data load and prep
xwoba_2025 = "data/team-xwoba-2025.csv"
xwoba_2024 = "data/team-xwoba-2024.csv"
df_2025 = process_baseball_data(xwoba_2025, 2025, end_date_str="2025-05-03")
df_2024 = process_baseball_data(xwoba_2024, 2024, end_date_str="2024-05-03")

df = pd.concat([df_2025, df_2024], ignore_index=True)
df["Plot Date"] = df['Game Date'].apply(
    lambda dt: pd.Timestamp(year=REFERENCE_YEAR, month=dt.month, day=dt.day)
)
df["Year"] = df["Game Date"].dt.year
df = df.sort_values(by="Plot Date")

fig = px.line(df, x="Plot Date", y="Rolling XWOBA", color="Year", markers=True,
    color_discrete_sequence=['blue', 'orange'])

league_average_xwoba_2025 = 0.326
fig.add_hline(y=league_average_xwoba_2025,
    line_dash="dash",
    line_color="red",
    annotation_text=f"2025 MLB Avg XWOBA ({league_average_xwoba_2025})",
    annotation_position="bottom right")

# Update layout and legend
fig.update_layout(
    xaxis_title='Game Date',
    yaxis_title='Rolling XWOBA',
    hovermode='x unified',
    title="Dodgers xwOBA (2024 vs 2025)"
)

fig.show()A hot start for the Dodgers! Figure 1 illustrates the Dodgers’ team rolling xwOBA from the start of the season throughout mid May for both 2024 and 2025.
We can see that the 2025 Dodgers started the season significantly hotter offensively compared to 2024, based on expected wOBA. However, their performance has dipped recently, bringing their rolling xwOBA closer to their 2024 levels around the same point in the season. Both years show the Dodgers performing well above the 2025 league average xwOBA.
Will the rest of 2025 look like 2024?
# data load and prep
xwoba_2025 = "data/team-xwoba-2025.csv"
xwoba_2024 = "data/team-xwoba-2024.csv"
df_2025 = process_baseball_data(xwoba_2025, 2025, end_date_str="2025-05-03")
df_2024 = process_baseball_data(xwoba_2024, 2024, end_date_str="2024-10-01")

df = pd.concat([df_2025, df_2024], ignore_index=True)
df["Plot Date"] = df['Game Date'].apply(
    lambda dt: pd.Timestamp(year=REFERENCE_YEAR, month=dt.month, day=dt.day)
)
df["Year"] = df["Game Date"].dt.year
df = df.sort_values(by="Plot Date")

fig = px.line(df, x="Plot Date", y="Rolling XWOBA", color="Year", markers=True,
    color_discrete_sequence=['blue', 'orange'])

league_average_xwoba_2024 = 0.312
fig.add_hline(y=league_average_xwoba_2024,
    line_dash="dash",
    line_color="red",
    annotation_text=f"2024 MLB Avg XWOBA ({league_average_xwoba_2024})",
    annotation_position="bottom right")

fig.update_layout(
    xaxis_title='Game Date',
    yaxis_title='Rolling XWOBA',
    hovermode='x unified',
    title="Dodgers xwOBA (2024 vs 2025)"
)

fig.show()Let’s sure hope we do not witness another late-May struggle.
While the team’s overall offensive performance has shown some regression towards 2024 levels, it’s important to look at individual player contributions. Let’s examine Shohei Ohtani’s rolling xwOBA as an example.
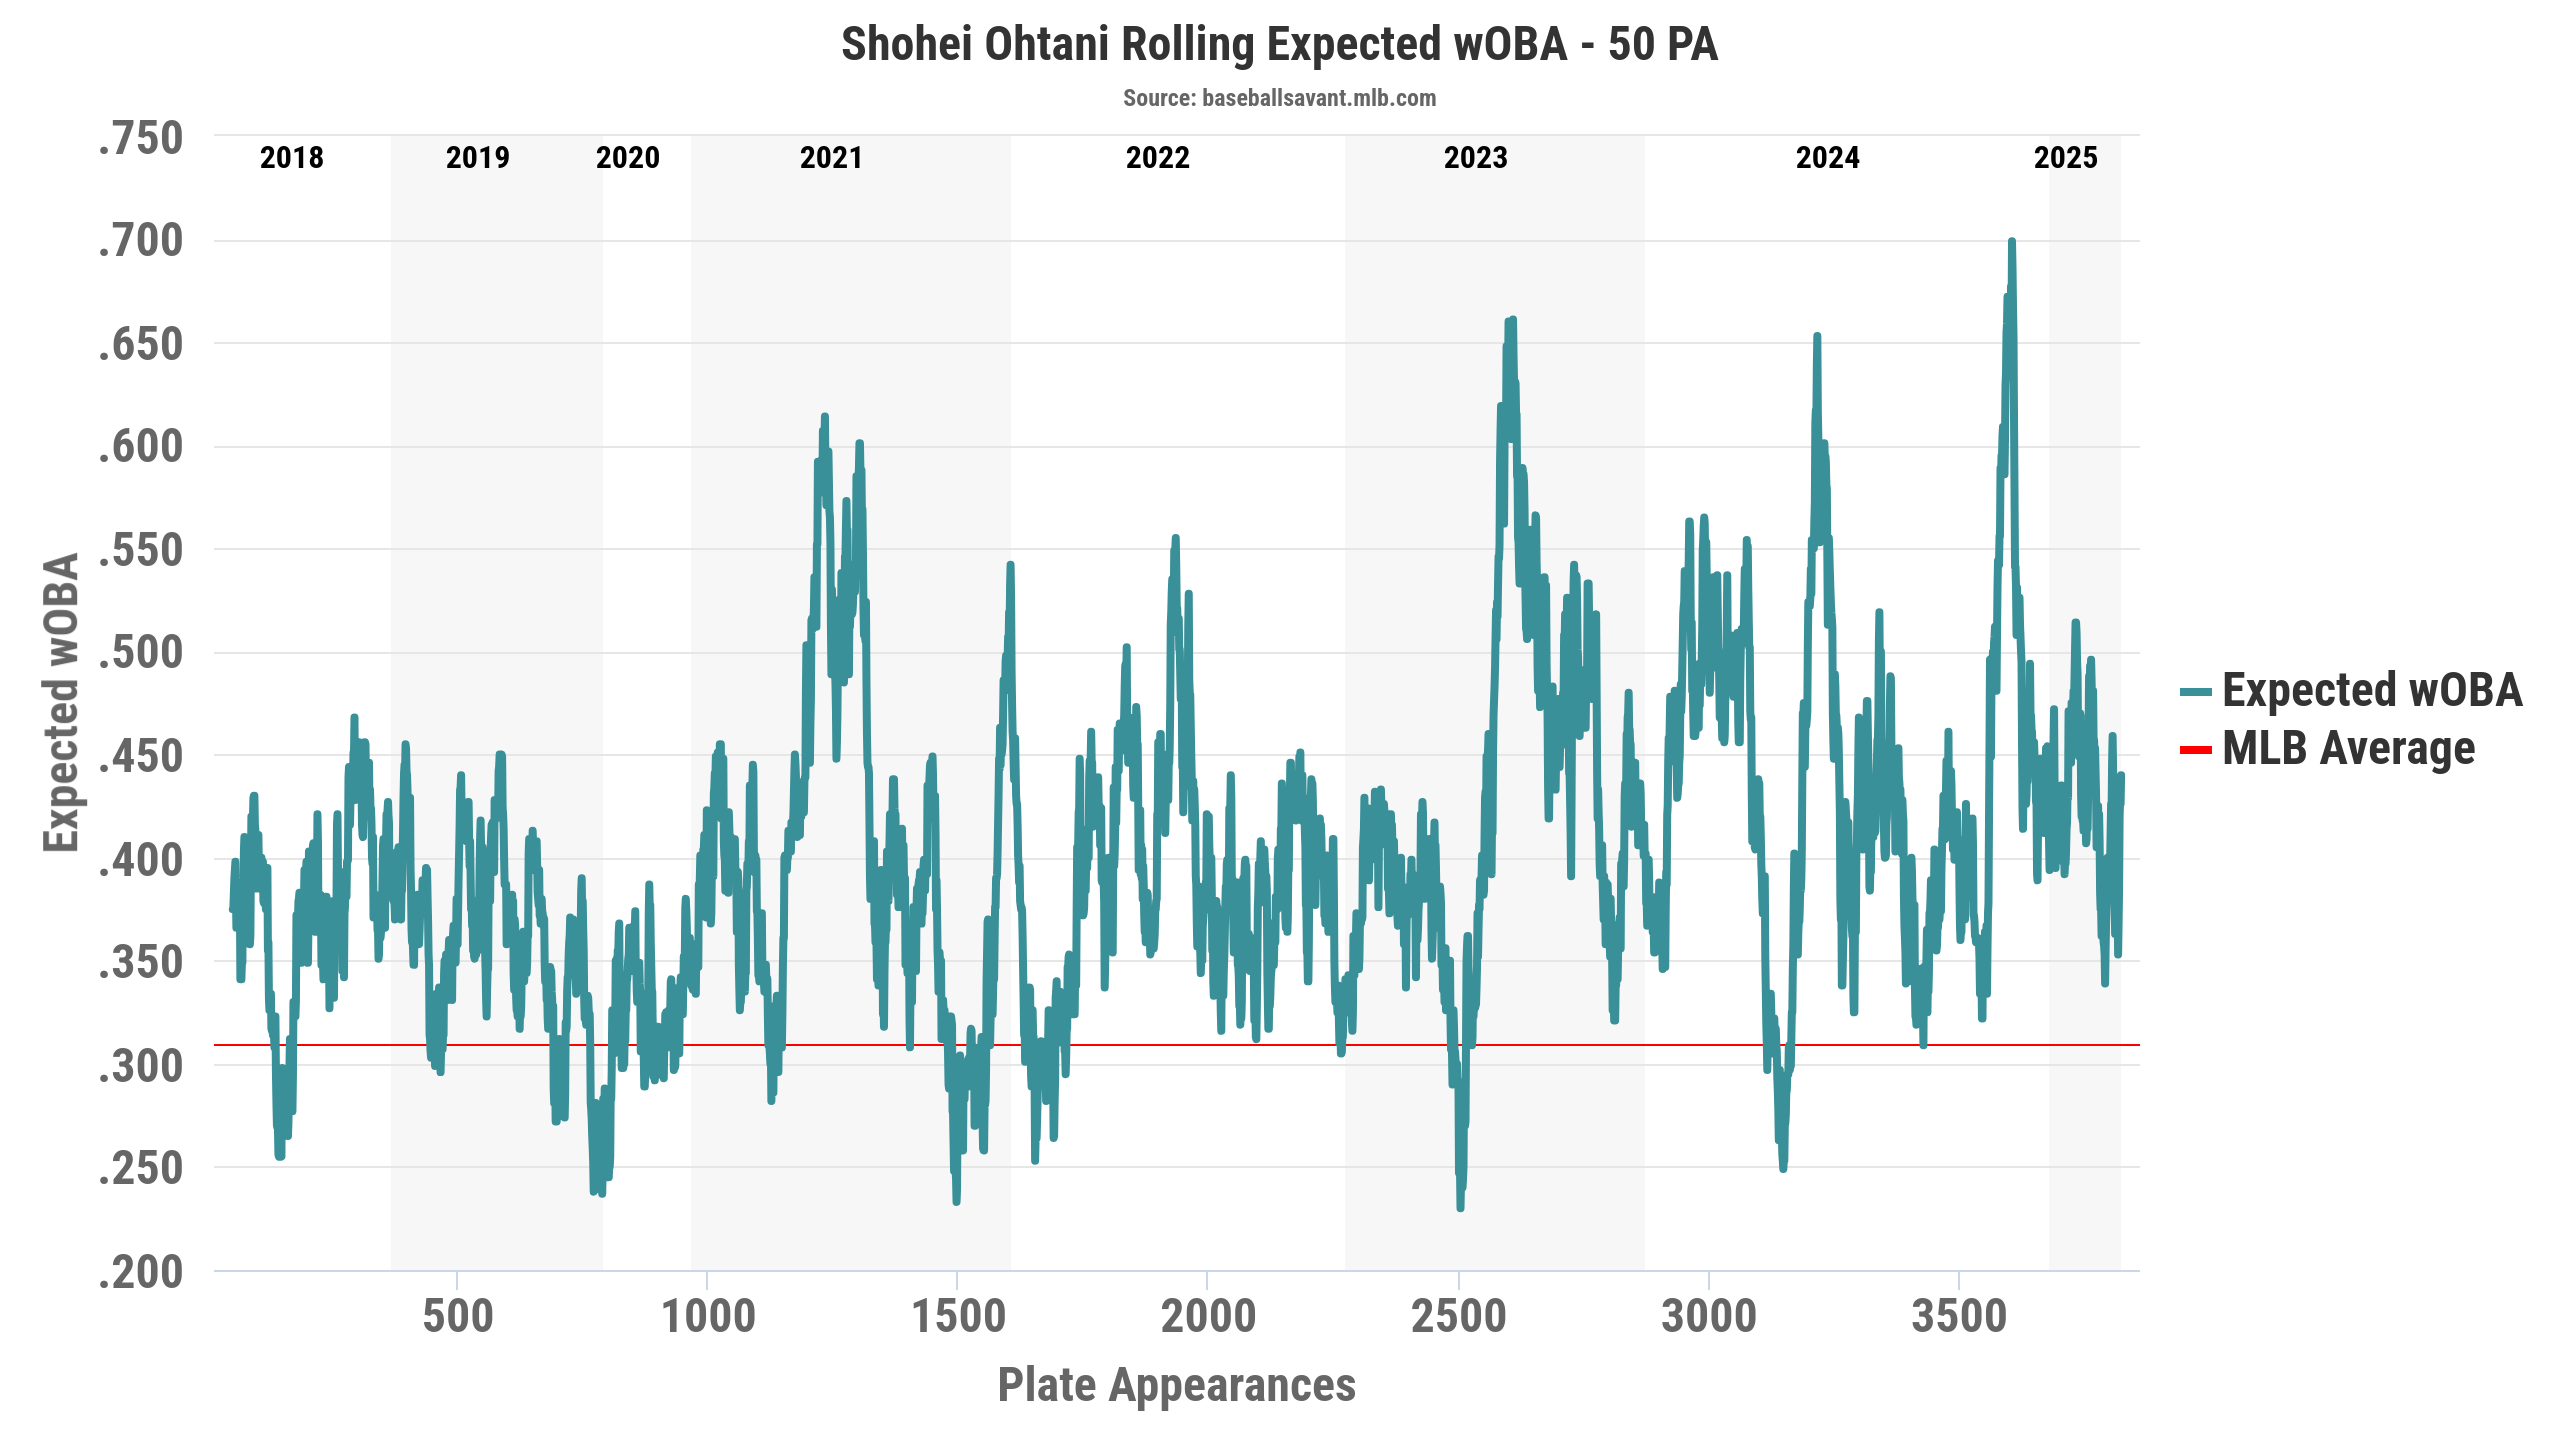
I am hedging my bets that Ohtani will win NL MVP again. Observe that Ohtani exhibits cylical patterns in his rolling xwOBA.
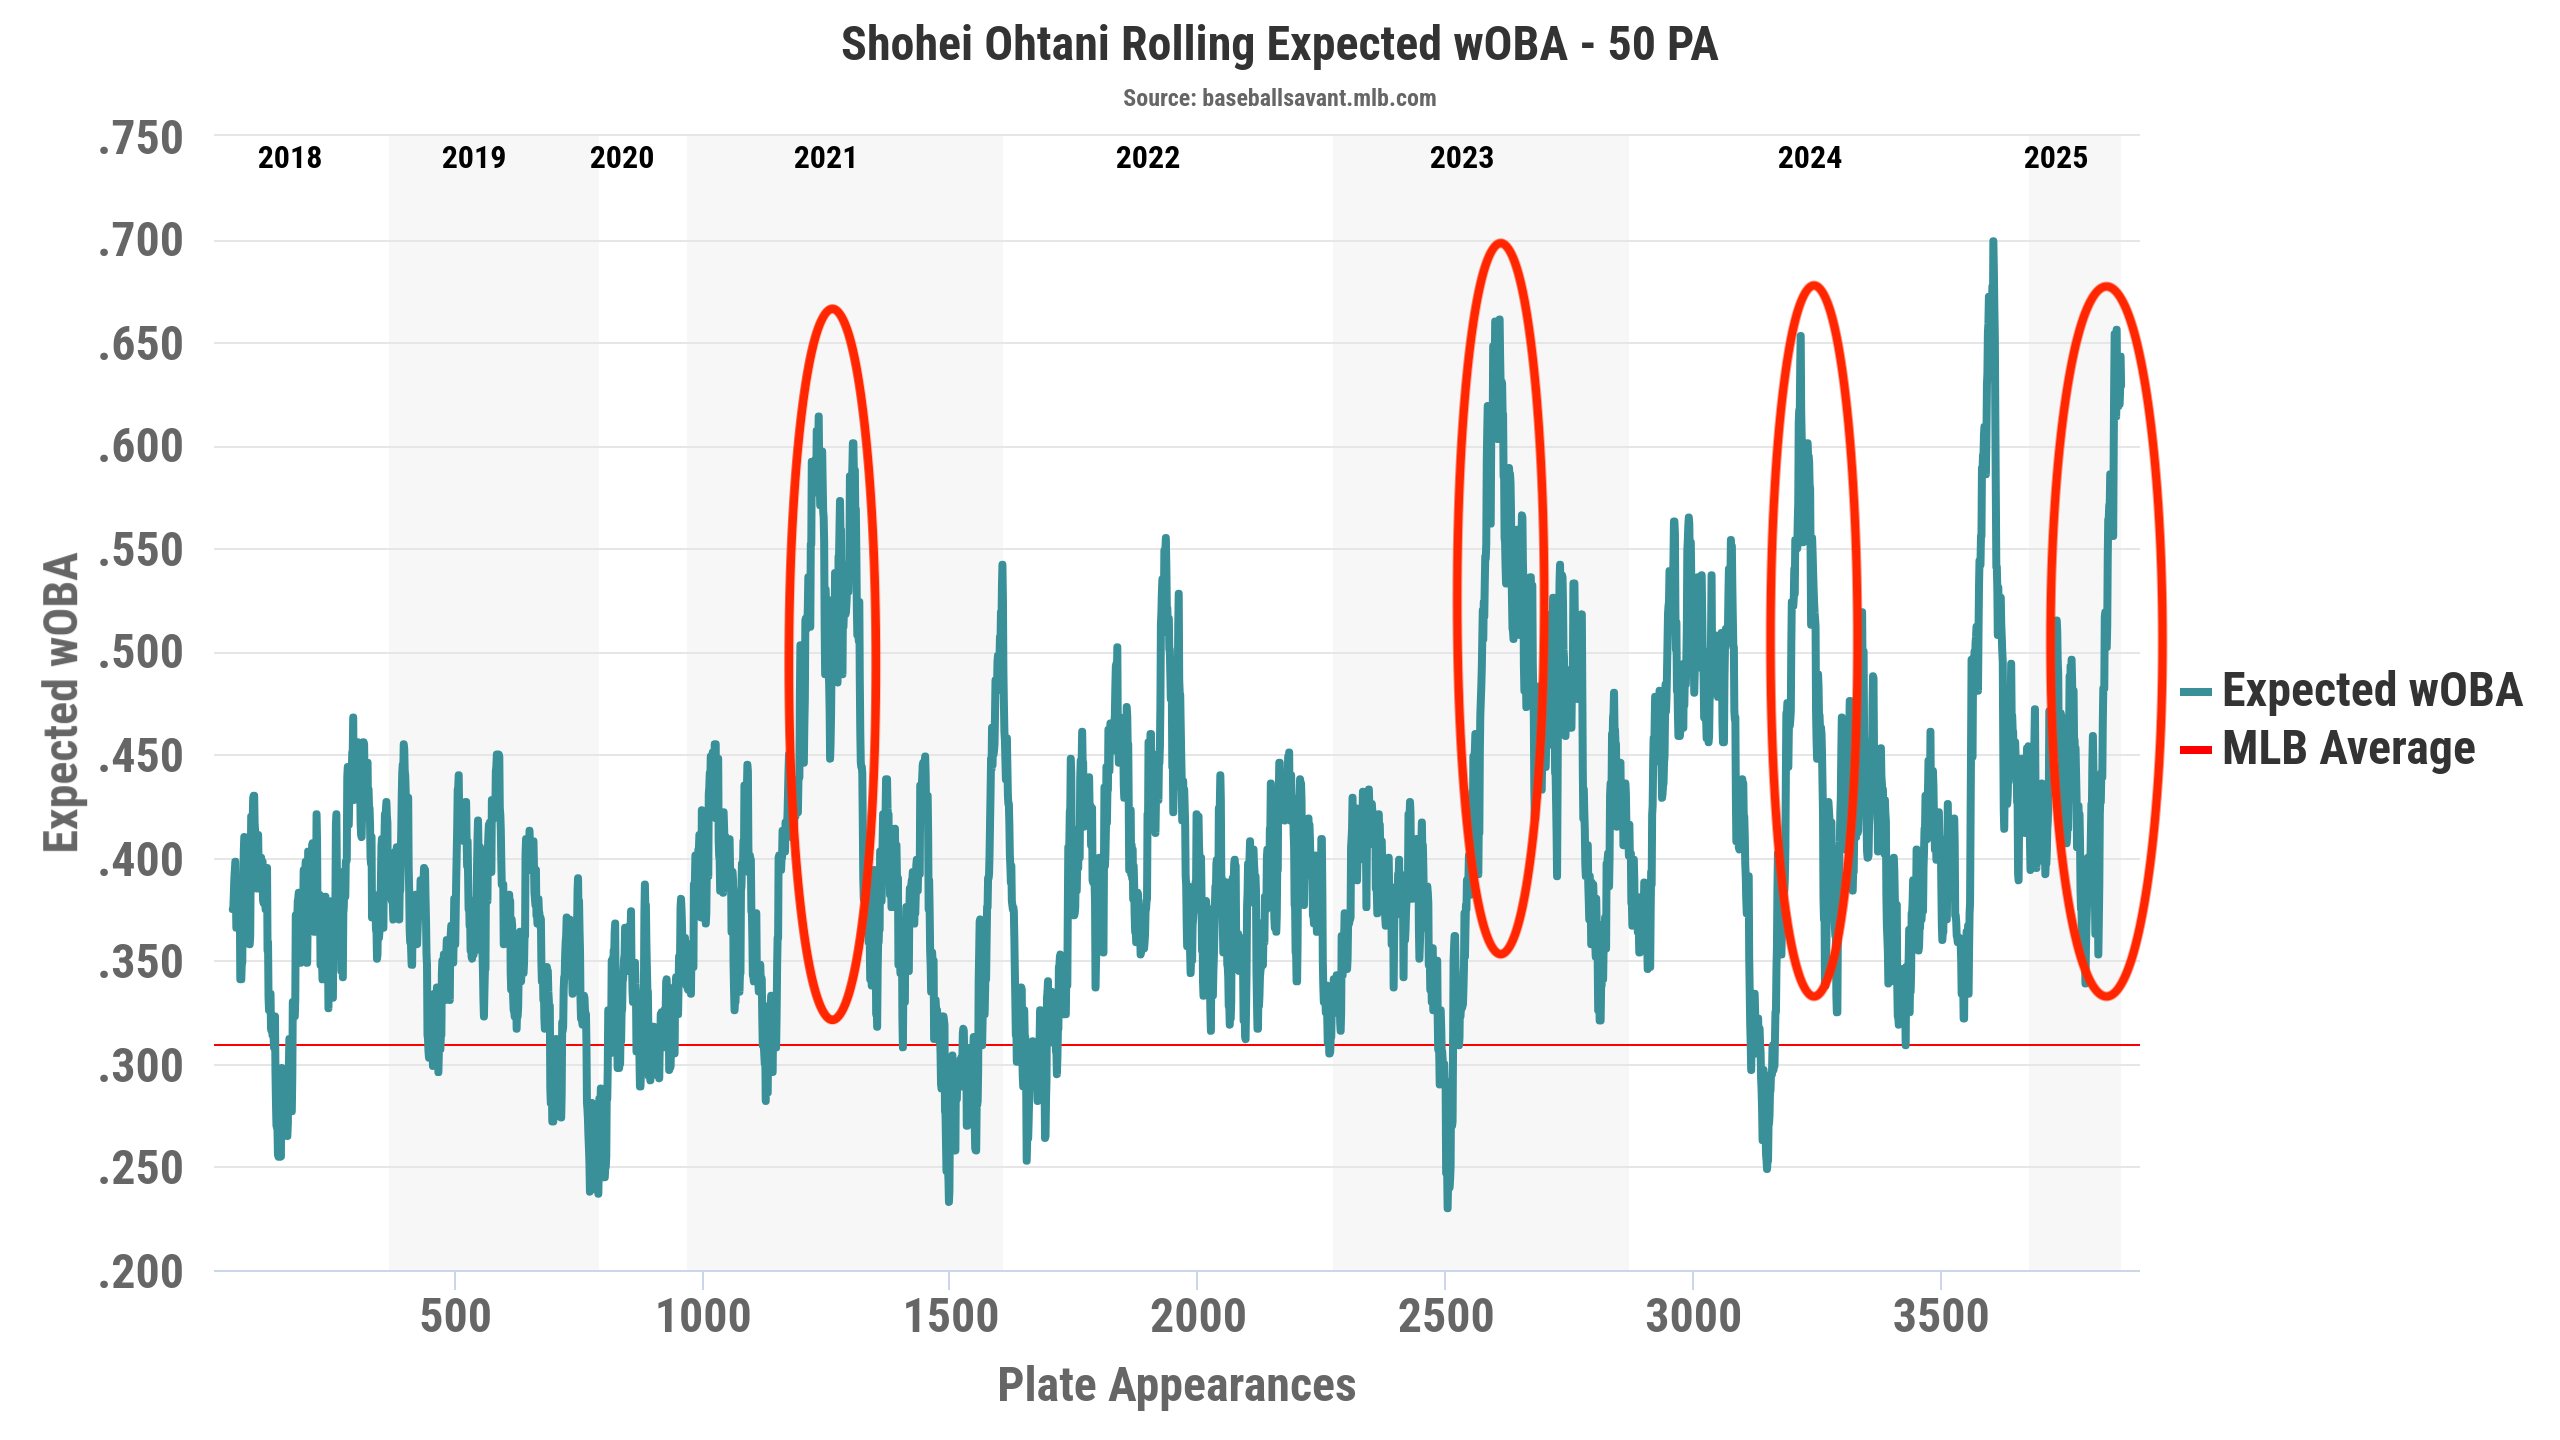
In 2021, Ohtani brandished an above 0.500 xwOBA during the summer months of the season. In 2021, writes a similar story to 2021 with the addition of a 1.0 OPS in August. Last year, a year unlike any other, Ohtani wins MVP, concluding his 2024 campaign with a 1.225 OPS in September and October.
Are we due for another Shohei Summer?
I rooting for it. However, with Ohtani pitching on the horizon after the all-star break, it will interesting to see how that will influence with offensive performance heading into the fall. 2023 Ohtani was as close as we will ever get to the most athletically impressive season in all of baseball. His batting slash line was .304/.412/.654 and boasted a 142 ERA+ on the season. Unfortunately, Ohtani had a season ending injury in his throwing elbow in 2023.
Is this symbolic of Icarsus’s Hubris? 2025, 2026, and 2027 will determine if Ohtani is Icarsus or a living God, standing among mere mortals. With only half a season of pitching, it is unkliekly Ohtani will garner any Cy Young votes. However, a full season of pitching, alongside a 1.0 OPS, will cement Ohtani as the greatest of all time.