Somewhere in Arizona and Florida, a groundskeeper wakes up every morning to tend to the fields, ensuring that the grass is perfectly manicured and the dirt is just right. When dawn turns to day, that field becomes a stage. Every swing, throw, and catch is meticulously recorded, added to the annals of baseball history.
As winter gives way to spring, the baseball world is abuzz with anticipation. Talk of over-unders, records, and player performance fills the air. But amid the chatter, one question looms: who will add the most barrels in 2026? A Barrel is a statcast metric that measures the quality of a batted ball, specifically those that are hit with a combination of exit velocity and launch angle that typically results in a high batting average and slugging percentage. Barrels are often used as a key indicator of a player’s power-hitting ability. By focusing on the exit velocity and launch angle, barrels try to isolate a player’s ability to make solid contact with the ball.
In this article, we investigate which MLB teams added and removed the most barrels from their rosters. However, a zealous statistician might wonder how we quantify “barrels” added/removed. We could just look at the 2025 season, but that would be too simplistic. We want to predict barrels for 2026, which means we need to look at the past few seasons for a better estimate. We will use a weighted average of the past three seasons (2025, 2024, and 2023) to project barrels for 2026. If a team adds an international free agent, we use their home run data to estimate their barrels.
The Data: Scraping, Cleaning, and Projecting
The data was collected from Fan Graphs. Specifically, we look at the offseason tracker for each team. For simplicity, we only consider free agents, trades, and prospective minor leaguers who are expected to make the major league roster.
Once we identify a key player, we grab their Barrel/PA data from Baseball Savant; we collect each player’s Barrel/PA for the past three seasons (2025, 2024, and 2023). If a player does not have a Barrel/PA for a given season, we just treat it as zero for the purpose of our weighted average calculation. In our dataset, we denote each player as an addition or subtraction for a team. Lastly, we get the project PA for each player from Fan Graph’s Zip projections.
Here’s what a data row looks like:
Code
import pandas as pdimport numpy as np# Set display options to show all columns and rowspd.set_option('display.max_columns', None)pd.set_option('display.max_rows', None)# Read the CSV filedf = pd.read_csv("the-barrel-ledger.csv")df[4:5]
Table 1
Team
Name
Transaction Type
Projected PA
Barrel/PA 2025
Barrel/PA 2024
Barrel/PA 2023
Team Change
HR 2025
HR 2024
HR 2023
4
SDP
Nick Castellanos
Free Agent
357
5.4
5.8
6.9
Addition
NaN
NaN
NaN
Sample Row: Nick Castellanos added to the Padres
Barrels in 2025 are weighted by 0.5, barrels in 2024 are weighted by 0.35, and barrels in 2023 are weighted by 0.15. If a player does not have Barrel/PA data, we estimate their barrels based on their home runs, using a rough estimate of 1.3 barrels per home run. For international players, we apply a 60% discount to the estimated barrels from home runs to account for the uncertainty in projecting their performance in MLB.
If Barrel/PA data is not available, then \text{Projected Barrels} = \text{Projected PA} \times 1.3 \times (0.5 \times \text{HR 2025} + \\ 0.35 \times \text{HR 2024} + \\ 0.15 \times \text{HR 2023}).
For international players, we apply a 60% discount to the estimated barrels from home runs, so \text{Projected Barrels} = \text{Projected PA} \times 1.3 \times (0.5 \times \text{HR 2025} + \\ 0.35 \times \text{HR 2024} + \\ 0.15 \times \text{HR 2023}) \times 0.4.
Let’s project Pete Alonso’s barrels for 2026, for example.
Code
def compute_projected_barrels(row):""" Compute projected barrels for a player. - If Barrel/PA data exists, use weighted average of available years (2025: 0.5, 2024: 0.35, 2023: 0.15) - Otherwise, estimate using HR data (assuming ~1.3 barrels per HR as a rough estimate), then apply 60% discount for international players """ weights = {'Barrel/PA 2025': 0.5, 'Barrel/PA 2024': 0.35, 'Barrel/PA 2023': 0.15} barrel_pa_values = [] barrel_pa_weights = []for col, weight in weights.items():if pd.notna(row[col]): barrel_pa_values.append(row[col]) barrel_pa_weights.append(weight)else: barrel_pa_values.append(0) barrel_pa_weights.append(0)ifsum(barrel_pa_weights) >0: total_weight =sum(barrel_pa_weights) normalized_weights = [w / total_weight for w in barrel_pa_weights] weighted_barrel_pa =sum(v * w for v, w inzip(barrel_pa_values, normalized_weights)) projected_barrels = row['Projected PA'] * (weighted_barrel_pa /100)else: hr_cols = ['HR 2025', 'HR 2024', 'HR 2023'] hr_weights_list = [0.5, 0.35, 0.15] hr_values = [] hr_weights = []for col, weight inzip(hr_cols, hr_weights_list):if pd.notna(row[col]): hr_values.append(row[col]) hr_weights.append(weight)if hr_values: total_weight =sum(hr_weights) normalized_weights = [w / total_weight for w in hr_weights] weighted_avg_hr =sum(v * w for v, w inzip(hr_values, normalized_weights)) projected_barrels = weighted_avg_hr *1.3 projected_barrels = projected_barrels *0.4else: projected_barrels = np.nanreturn projected_barrelsdf['Projected Barrels'] = df.apply(compute_projected_barrels, axis=1)result_df = df[['Team', 'Name', 'Projected PA', 'Barrel/PA 2025', 'Barrel/PA 2024', 'Barrel/PA 2023', 'HR 2025', 'HR 2024', 'HR 2023', 'Projected Barrels']]result_df = result_df.sort_values(by='Projected Barrels', ascending=False)result_df[0:1][["Name", "Projected Barrels"]]
Table 2
Name
Projected Barrels
70
Pete Alonso
72.07585
Sample Row: Pete Alonso projected barrels
72 barrels for Pete Alonso. A reasonable projection since his barrels for 2025, 2024, and 2023 were 89, 58, and 62 respectively.
The Ledger: Who Added Most Barrels?
Now that we have projected barrels for each player, we can calculate the net barrels added or removed for each team. Net barrels is as follows:
\text{Net Barrels} = \text{Incoming Player Brl/PA} \times \text{Projected PA} \\ - \text{Departing Player Brl/PA} \times \text{Projected PA}.
Here’s the list of MLB teams who added the most barrels.
Code
# Calculate net barrels by team# Add projected barrels for incoming players, subtract for departing playersfrom IPython.display import Markdownfrom tabulate import tabulatenet_barrels_by_team = []for team in df['Team'].unique(): team_df = df[df['Team'] == team]# Sum projected barrels for additions (incoming players) additions =round(team_df[team_df['Team Change'] =='Addition']['Projected Barrels'].sum(), 2)# Sum projected barrels for subtractions (departing players) subtractions = team_df[team_df['Team Change'] =='Subtraction']['Projected Barrels'].sum()# Calculate net barrels net_barrels = additions - subtractions net_barrels_by_team.append({'Team': team,'Additions (Barrels)': round(additions, 2),'Subtractions (Barrels)': round(subtractions, 2),'Net Barrels': round(net_barrels, 2) })# Create a dataframe with net barrelsnet_df = pd.DataFrame(net_barrels_by_team).sort_values('Additions (Barrels)', ascending=False).reset_index(drop=True)net_df.index = net_df.index +1Markdown(tabulate(net_df[["Team", "Additions (Barrels)"]]))
Table 3
1
NYM
146.66
2
BAL
142.6
3
PIT
125.6
4
COL
80.26
5
CIN
78.3
6
MIN
74.89
7
TOR
67.77
8
BOS
67.32
9
CHW
61.58
10
TEX
56.22
11
MIA
55.07
12
TBR
53.39
13
ATL
52.89
14
LAD
51.53
15
SDP
51.49
16
SEA
50.79
17
PHI
50.36
18
SFG
39.37
19
CHC
39.33
20
LAA
37.19
21
ARI
34.86
22
MIL
32.48
23
ATH
26.15
24
KCR
25.32
25
HOU
13.5
26
WSN
7.38
27
NYY
0.36
28
STL
0
29
CLE
0
30
DET
0
Net Barrels Added/Removed by Team
The New York Mets lead MLB with 147 barrels added. While they lose Pete Alonso, they add Bo Bichette, Jorge Polanco, and Marcus Semien, among others. Not surprisingly, the Baltimore Orioles trail in second with 142 barrels. The Orioles add Pete Alonso! Overlooked amid the excitement, Taylor Ward also joins the Orioles from the Angels. The Pittsburgh Pirates round out the top three with 125 barrels. They are going to be an interesting team to watch in 2026. Marcel Ozuna would give the Pirates much-needed plate discipline and power. Perhaps he can instill more plate discipline in Cruz’s approach to at-bats.
Who net the most barrels?
More importantly, who net the most barrels?
Code
# Create a dataframe with net barrelsnet_df = pd.DataFrame(net_barrels_by_team).sort_values('Net Barrels', ascending=False).reset_index(drop=True)net_df.index = net_df.index +1net_df['Net Barrels'] = net_df['Net Barrels'].map(lambda x: f"{x:8.2f}")Markdown(tabulate(net_df[["Team", "Net Barrels"]]))
Table 4
1
BAL
126.41
2
PIT
87.94
3
COL
68.22
4
TOR
50.03
5
CIN
43.48
6
MIN
42.93
7
MIA
28.27
8
LAD
25.26
9
CHW
23.19
10
SFG
13.94
11
ARI
9.6
12
SDP
9.23
13
ATH
8.72
14
ATL
7.31
15
BOS
7.18
16
NYY
0.36
17
CLE
-1.23
18
PHI
-8.65
19
DET
-16.81
20
LAA
-29.9
21
KCR
-30.59
22
MIL
-31.74
23
WSN
-36.31
24
SEA
-41.88
25
NYM
-45.88
26
TBR
-48.05
27
TEX
-52.75
28
HOU
-58.73
29
CHC
-82.45
30
STL
-98.15
Net Barrels Lost by Team
The O’s net the most barrels this offseason, garnering 126. That’s a huge boost for a team that had a poor 2025 season. The biggest additions are Pete Alonso and Taylor Ward; those two will be a fearsome pair in the lineup. More importantly, the players they lose include Gary Sanchez, Jorge Mateo, and Alex Jackson. All of that said, the Orioles should be a formidable team in 2026.
Following the Orioles are the Pittsburgh Pirates with 88 net barrels added. In addition to Ozuna, Ryan O’Hearn joins the Pirates. They lose Andrew McCutchen and Ke’Bryan Hayes, but, quite frankly, their heyday is behind them. Expect the Pirates to be in the mix for the NL Central two or three spot.
Before discussing the Colorado Rockies, it should be noted that they add Paul DePodesta to their front office staff as President of Baseball Operations. DePodesta, portrayed by Jonah Hill in the movie Moneyball, is a pioneer in the use of sabermetrics in baseball. The Rockies, with their 43 wins last season, offer a clean opportunity; a chance for DePodesta to implement his novel vision for the team. With that, the Rockies add Willi Castro, Eduoard Julien, and Jack McCarthy, among others. These players are not household names, but, in the aggregate, they roughly add 80 barrels. It’s the Moneyball philosophy in action. If their main loss is Thairo Estrada, from their embarrassing season, then the Rockies should be in a much better position in 2026.
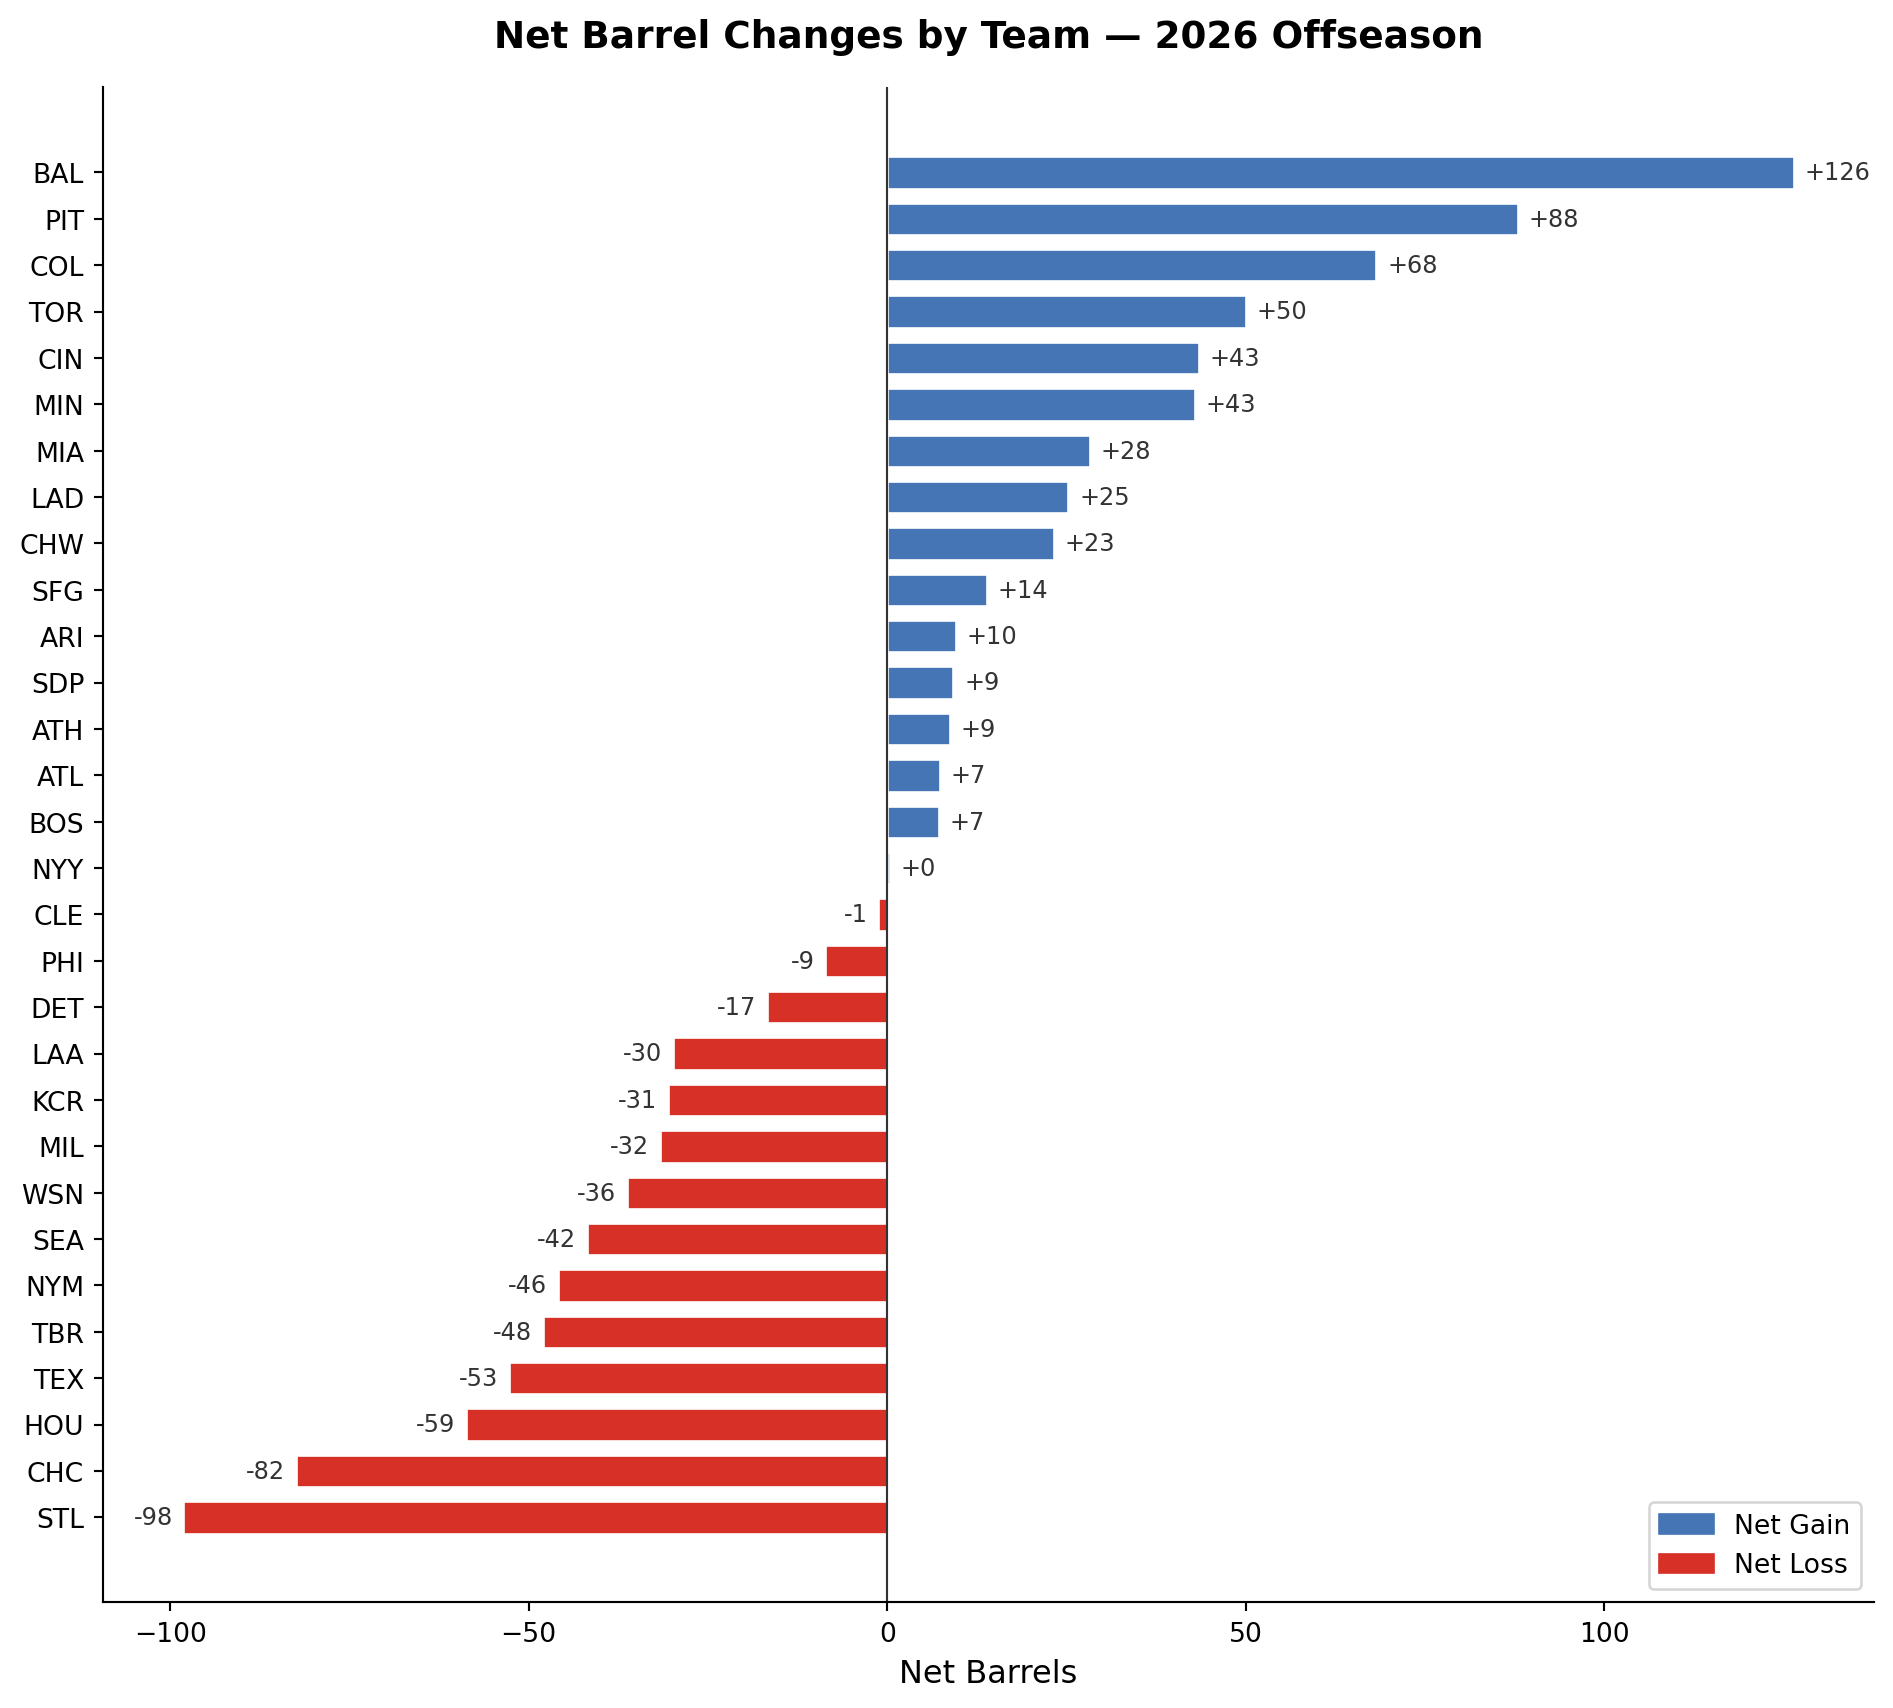
The figure below shows the net barrels added or removed by each team. The blue bars indicate net gains, while the red bars indicate net losses. The teams are sorted by net barrels, with the team that added the most barrels at the top and the team that lost the most barrels at the bottom.
Code
import matplotlib.pyplot as pltimport matplotlib.patches as mpatchesplot_df = pd.DataFrame(net_barrels_by_team).sort_values('Net Barrels', ascending=True).reset_index(drop=True)colors = ['#d73027'if x <0else'#4575b4'for x in plot_df['Net Barrels']]fig, ax = plt.subplots(figsize=(10, 9))bars = ax.barh(plot_df['Team'], plot_df['Net Barrels'], color=colors, edgecolor='white', height=0.7)for bar, val inzip(bars, plot_df['Net Barrels']): offset =1.5 ax.text( val + (offset if val >=0else-offset), bar.get_y() + bar.get_height() /2,f'{val:+.0f}', va='center', ha='left'if val >=0else'right', fontsize=9, color='#333333' )ax.axvline(0, color='#333333', linewidth=0.8)ax.set_xlabel('Net Barrels', fontsize=12)ax.set_title('Net Barrel Changes by Team — 2026 Offseason', fontsize=14, fontweight='bold', pad=15)gain_patch = mpatches.Patch(color='#4575b4', label='Net Gain')loss_patch = mpatches.Patch(color='#d73027', label='Net Loss')ax.legend(handles=[gain_patch, loss_patch], loc='lower right', fontsize=10)ax.spines['top'].set_visible(False)ax.spines['right'].set_visible(False)ax.tick_params(axis='y', labelsize=10)ax.tick_params(axis='x', labelsize=10)plt.tight_layout()plt.show()
Figure 1: Net Barrel Changes by Team - 2026 Offseason
Conclusion
Barrels are not the whole story. A team can lead the league in barrels and still lose 90 games if the rotation crumbles or the bullpen hemorrhages leads. What this ledger offers is a narrow but useful lens: which organizations made deliberate, quantifiable investments in hard contact?
By that measure, three teams stand out. The Orioles are the clearest winner, pairing Pete Alonso’s prodigious barrel rate with a roster that shed dead weight. After a dismal 2025, Baltimore has the ingredients for a genuine bounce-back. The Pirates are the most intriguing dark horse; Ozuna is a legitimate middle-of-the-order threat, and if Cruz matures at the plate, Pittsburgh could surprise the NL Central. The Rockies are the longest of long shots, but DePodesta’s arrival signals that the organization is finally thinking rigorously about roster construction. Forty-three wins is a low bar. Clearing it will not require much.
On the other side of the ledger, teams that shed barrels without replenishing them face an uphill climb. Power is difficult to manufacture mid-season. The teams in the red on the chart above have bet that pitching, defense, or depth will compensate. Some will be right. Most will not.
Spring training will soon give way to the real thing. The groundskeeper’s work will be done, and the numbers will start to speak for themselves. Check back in October.
---title: "The Barrel Ledger: Projecting Barrels for 2025"author: "Oliver Chang"email: oliverc1622@gmail.comdate: 2026-03-24 # Update this date when you make changescategories: []toc: trueformat: html: html-math-method: katex code-tools: trueimage: "ledger.png"title-block-banner: default---<iframe src="https://streamable.com/m/oneil-cruz-homers-11-on-a-fly-ball-to-right-field?partnerId=web_multimedia-search_video-share" width="560" height="315"></iframe>## IntroductionSomewhere in Arizona and Florida, a groundskeeper wakes up every morning to tend to the fields, ensuring that the grass is perfectly manicured and the dirt is just right. When dawn turns to day, that field becomes a stage. Every swing, throw, and catch is meticulously recorded, added to the annals of baseball history. As winter gives way to spring, the baseball world is abuzz with anticipation. Talk of over-unders, records, and player performance fills the air. But amid the chatter, one question looms: who will add the most barrels in 2026? A [Barrel](https://www.mlb.com/glossary/statcast/barrel) is a [statcast](https://baseballsavant.mlb.com/) metric that measures the quality of a batted ball, specifically those that are hit with a combination of exit velocity and launch angle that typically results in a high batting average and slugging percentage. Barrels are often used as a key indicator of a player's power-hitting ability. By focusing on the exit velocity and launch angle, barrels try to isolate a player's ability to make solid contact with the ball. In this article, we investigate which MLB teams added and removed the most barrels from their rosters. However, a zealous statistician might wonder how we quantify "barrels" added/removed. We could just look at the 2025 season, but that would be too simplistic. We want to predict barrels for 2026, which means we need to look at the past few seasons for a better estimate. We will use a weighted average of the past three seasons (2025, 2024, and 2023) to project barrels for 2026. If a team adds an international free agent, we use their home run data to estimate their barrels. ## The Data: Scraping, Cleaning, and ProjectingThe data was collected from [Fan Graphs](https://www.fangraphs.com/roster-resource/offseason-tracker/padres). Specifically, we look at the offseason tracker for each team. For simplicity, we only consider free agents, trades, and prospective minor leaguers who are expected to make the major league roster. Once we identify a key player, we grab their Barrel/PA data from [Baseball Savant](https://baseballsavant.mlb.com/); we collect each player's Barrel/PA for the past three seasons (2025, 2024, and 2023). If a player does not have a Barrel/PA for a given season, we just treat it as zero for the purpose of our weighted average calculation. In our dataset, we denote each player as an addition or subtraction for a team. Lastly, we get the project PA for each player from Fan Graph's [Zip projections](https://www.fangraphs.com/projections?pos=all&stats=bat&type=zips). Here's what a data row looks like:```{python}#| code-fold: true#| warning: true#| label: tbl-sample-row#| fig-cap: "Sample Row: Nick Castellanos added to the Padres"#| fig-alt: "Sample Row: Nick Castellanos added to the Padres"import pandas as pdimport numpy as np# Set display options to show all columns and rowspd.set_option('display.max_columns', None)pd.set_option('display.max_rows', None)# Read the CSV filedf = pd.read_csv("the-barrel-ledger.csv")df[4:5]```Barrels in 2025 are weighted by 0.5, barrels in 2024 are weighted by 0.35, and barrels in 2023 are weighted by 0.15. If a player does not have Barrel/PA data, we estimate their barrels based on their home runs, using a rough estimate of 1.3 barrels per home run. For international players, we apply a 60% discount to the estimated barrels from home runs to account for the uncertainty in projecting their performance in MLB. Thus, a player's projected barrels are$$\text{Projected Barrels} = \text{Projected PA} \times (0.5 \times \text{Barrel/PA 2025} + \\ 0.35 \times \text{Barrel/PA 2024} + \\ 0.15 \times \text{Barrel/PA 2023}).$$If Barrel/PA data is not available, then $$\text{Projected Barrels} = \text{Projected PA} \times 1.3 \times (0.5 \times \text{HR 2025} + \\ 0.35 \times \text{HR 2024} + \\ 0.15 \times \text{HR 2023}).$$For international players, we apply a 60% discount to the estimated barrels from home runs, so $$\text{Projected Barrels} = \text{Projected PA} \times 1.3 \times (0.5 \times \text{HR 2025} + \\ 0.35 \times \text{HR 2024} + \\ 0.15 \times \text{HR 2023}) \times 0.4.$$Let's project Pete Alonso's barrels for 2026, for example. ```{python}#| code-fold: true#| warning: true#| label: tbl-pete-alonso#| fig-cap: "Sample Row: Pete Alonso projected barrels"#| fig-alt: "Sample Row: Pete Alonso projected barrels"def compute_projected_barrels(row):""" Compute projected barrels for a player. - If Barrel/PA data exists, use weighted average of available years (2025: 0.5, 2024: 0.35, 2023: 0.15) - Otherwise, estimate using HR data (assuming ~1.3 barrels per HR as a rough estimate), then apply 60% discount for international players """ weights = {'Barrel/PA 2025': 0.5, 'Barrel/PA 2024': 0.35, 'Barrel/PA 2023': 0.15} barrel_pa_values = [] barrel_pa_weights = []for col, weight in weights.items():if pd.notna(row[col]): barrel_pa_values.append(row[col]) barrel_pa_weights.append(weight)else: barrel_pa_values.append(0) barrel_pa_weights.append(0)ifsum(barrel_pa_weights) >0: total_weight =sum(barrel_pa_weights) normalized_weights = [w / total_weight for w in barrel_pa_weights] weighted_barrel_pa =sum(v * w for v, w inzip(barrel_pa_values, normalized_weights)) projected_barrels = row['Projected PA'] * (weighted_barrel_pa /100)else: hr_cols = ['HR 2025', 'HR 2024', 'HR 2023'] hr_weights_list = [0.5, 0.35, 0.15] hr_values = [] hr_weights = []for col, weight inzip(hr_cols, hr_weights_list):if pd.notna(row[col]): hr_values.append(row[col]) hr_weights.append(weight)if hr_values: total_weight =sum(hr_weights) normalized_weights = [w / total_weight for w in hr_weights] weighted_avg_hr =sum(v * w for v, w inzip(hr_values, normalized_weights)) projected_barrels = weighted_avg_hr *1.3 projected_barrels = projected_barrels *0.4else: projected_barrels = np.nanreturn projected_barrelsdf['Projected Barrels'] = df.apply(compute_projected_barrels, axis=1)result_df = df[['Team', 'Name', 'Projected PA', 'Barrel/PA 2025', 'Barrel/PA 2024', 'Barrel/PA 2023', 'HR 2025', 'HR 2024', 'HR 2023', 'Projected Barrels']]result_df = result_df.sort_values(by='Projected Barrels', ascending=False)result_df[0:1][["Name", "Projected Barrels"]]```72 barrels for Pete Alonso. A reasonable projection since his barrels for 2025, 2024, and 2023 were 89, 58, and 62 respectively. ## The Ledger: Who Added Most Barrels?Now that we have projected barrels for each player, we can calculate the net barrels added or removed for each team. Net barrels is as follows:$$ \text{Net Barrels} = \text{Incoming Player Brl/PA} \times \text{Projected PA} \\ - \text{Departing Player Brl/PA} \times \text{Projected PA}.$$Here's the list of MLB teams who added the most barrels.```{python}#| code-fold: true#| warning: true#| label: tbl-net-barrels#| fig-cap: "Net Barrels Added/Removed by Team"#| fig-alt: "Net Barrels Added/Removed by Team"# Calculate net barrels by team# Add projected barrels for incoming players, subtract for departing playersfrom IPython.display import Markdownfrom tabulate import tabulatenet_barrels_by_team = []for team in df['Team'].unique(): team_df = df[df['Team'] == team]# Sum projected barrels for additions (incoming players) additions =round(team_df[team_df['Team Change'] =='Addition']['Projected Barrels'].sum(), 2)# Sum projected barrels for subtractions (departing players) subtractions = team_df[team_df['Team Change'] =='Subtraction']['Projected Barrels'].sum()# Calculate net barrels net_barrels = additions - subtractions net_barrels_by_team.append({'Team': team,'Additions (Barrels)': round(additions, 2),'Subtractions (Barrels)': round(subtractions, 2),'Net Barrels': round(net_barrels, 2) })# Create a dataframe with net barrelsnet_df = pd.DataFrame(net_barrels_by_team).sort_values('Additions (Barrels)', ascending=False).reset_index(drop=True)net_df.index = net_df.index +1Markdown(tabulate(net_df[["Team", "Additions (Barrels)"]]))```The New York Mets lead MLB with 147 barrels added. While they lose Pete Alonso, they add Bo Bichette, Jorge Polanco, and Marcus Semien, among others. Not surprisingly, the Baltimore Orioles trail in second with 142 barrels. The Orioles add Pete Alonso! Overlooked amid the excitement, Taylor Ward also joins the Orioles from the Angels. The Pittsburgh Pirates round out the top three with 125 barrels. They are going to be an interesting team to watch in 2026. Marcel Ozuna would give the Pirates much-needed plate discipline and power. Perhaps he can instill more plate discipline in Cruz's approach to at-bats. ### Who net the most barrels?More importantly, who *net* the most barrels? ```{python}#| code-fold: true#| warning: true#| label: tbl-net-barrels-loss#| fig-cap: "Net Barrels Lost by Team"#| fig-alt: "Net Barrels Lost by Team"# Create a dataframe with net barrelsnet_df = pd.DataFrame(net_barrels_by_team).sort_values('Net Barrels', ascending=False).reset_index(drop=True)net_df.index = net_df.index +1net_df['Net Barrels'] = net_df['Net Barrels'].map(lambda x: f"{x:8.2f}")Markdown(tabulate(net_df[["Team", "Net Barrels"]]))```The O's net the most barrels this offseason, garnering 126. That's a huge boost for a team that had a poor 2025 season. The biggest additions are Pete Alonso and Taylor Ward; those two will be a fearsome pair in the lineup. More importantly, the players they lose include Gary Sanchez, Jorge Mateo, and Alex Jackson. All of that said, the Orioles should be a formidable team in 2026.Following the Orioles are the Pittsburgh Pirates with 88 net barrels added. In addition to Ozuna, Ryan O'Hearn joins the Pirates. They lose Andrew McCutchen and Ke'Bryan Hayes, but, quite frankly, their heyday is behind them. Expect the Pirates to be in the mix for the NL Central two or three spot. Before discussing the Colorado Rockies, it should be noted that they add Paul DePodesta to their front office staff as President of Baseball Operations. DePodesta, portrayed by Jonah Hill in the movie [Moneyball](https://www.imdb.com/title/tt1210166/), is a pioneer in the use of sabermetrics in baseball. The Rockies, with their 43 wins last season, offer a clean opportunity; a chance for DePodesta to implement his novel vision for the team. With that, the Rockies add Willi Castro, Eduoard Julien, and Jack McCarthy, among others. These players are not household names, but, in the aggregate, they roughly add 80 barrels. It's the Moneyball philosophy in action. If their main loss is Thairo Estrada, from their embarrassing season, then the Rockies should be in a much better position in 2026.The figure below shows the net barrels added or removed by each team. The blue bars indicate net gains, while the red bars indicate net losses. The teams are sorted by net barrels, with the team that added the most barrels at the top and the team that lost the most barrels at the bottom.```{python}#| code-fold: true#| warning: false#| label: fig-net-barrels-chart#| fig-cap: "Net Barrel Changes by Team - 2026 Offseason"#| fig-alt: "Horizontal diverging bar chart showing net barrel changes by MLB team for the 2026 offseason. Blue bars indicate net gains; red bars indicate net losses."import matplotlib.pyplot as pltimport matplotlib.patches as mpatchesplot_df = pd.DataFrame(net_barrels_by_team).sort_values('Net Barrels', ascending=True).reset_index(drop=True)colors = ['#d73027'if x <0else'#4575b4'for x in plot_df['Net Barrels']]fig, ax = plt.subplots(figsize=(10, 9))bars = ax.barh(plot_df['Team'], plot_df['Net Barrels'], color=colors, edgecolor='white', height=0.7)for bar, val inzip(bars, plot_df['Net Barrels']): offset =1.5 ax.text( val + (offset if val >=0else-offset), bar.get_y() + bar.get_height() /2,f'{val:+.0f}', va='center', ha='left'if val >=0else'right', fontsize=9, color='#333333' )ax.axvline(0, color='#333333', linewidth=0.8)ax.set_xlabel('Net Barrels', fontsize=12)ax.set_title('Net Barrel Changes by Team — 2026 Offseason', fontsize=14, fontweight='bold', pad=15)gain_patch = mpatches.Patch(color='#4575b4', label='Net Gain')loss_patch = mpatches.Patch(color='#d73027', label='Net Loss')ax.legend(handles=[gain_patch, loss_patch], loc='lower right', fontsize=10)ax.spines['top'].set_visible(False)ax.spines['right'].set_visible(False)ax.tick_params(axis='y', labelsize=10)ax.tick_params(axis='x', labelsize=10)plt.tight_layout()plt.show()```## ConclusionBarrels are not the whole story. A team can lead the league in barrels and still lose 90 games if the rotation crumbles or the bullpen hemorrhages leads. What this ledger offers is a narrow but useful lens: which organizations made deliberate, quantifiable investments in hard contact?By that measure, three teams stand out. The Orioles are the clearest winner, pairing Pete Alonso's prodigious barrel rate with a roster that shed dead weight. After a dismal 2025, Baltimore has the ingredients for a genuine bounce-back. The Pirates are the most intriguing dark horse; Ozuna is a legitimate middle-of-the-order threat, and if Cruz matures at the plate, Pittsburgh could surprise the NL Central. The Rockies are the longest of long shots, but DePodesta's arrival signals that the organization is finally thinking rigorously about roster construction. Forty-three wins is a low bar. Clearing it will not require much.On the other side of the ledger, teams that shed barrels without replenishing them face an uphill climb. Power is difficult to manufacture mid-season. The teams in the red on the chart above have bet that pitching, defense, or depth will compensate. Some will be right. Most will not.Spring training will soon give way to the real thing. The groundskeeper's work will be done, and the numbers will start to speak for themselves. Check back in October.:::{.callout-note}Past articles: - [Principal Component Analysis](https://runningonnumbers.com/posts/principal-component-analysis-python-baseball/)- [Barrels Are All You Need](https://runningonnumbers.com/posts/barrels-are-all-you-need/)- [K-Means Clustering](https://runningonnumbers.com/posts/k-means/)Github:- [Running on Numbers](https://github.com/oliverc1623/Running-On-Numbers-Public):::<script async data-uid="5d16db9e50" src="https://runningonnumbers.kit.com/5d16db9e50/index.js"></script>